Category: Learning
-

What Does It Mean for a Column to Be Indexed?
Imagine trying to find a book in a huge library without a catalog – it would take forever! Indexes in databases work like that catalog, making it easy to find the information you need quickly. In this guide, we’ll explain what indexes are, focusing on a popular type called B-trees. We’ll also show you how…
-

Power BI’s AI Visuals in Action: Q&A
The data utilized for demonstration purposes was sourced from Kaggle. Effective dashboards are designed to deliver high-level, relevant information at a glance, empowered by potent visualizations. To enhance this capability, Microsoft has developed an innovative AI feature in Power BI called Q&A, allowing users to ask data-related questions in natural English and receive instant visual…
-

The Essentials of Business Intelligence: Getting Started with Power BI
There was a time when business decisions were made based on gut instinct, personal experience, and a dash of luck. But as the digital revolution took hold, a new era of data-driven decision-making emerged. At the forefront of this transformation is Microsoft’s Power BI, a tool that epitomizes the evolution of business intelligence. Discover how…
-
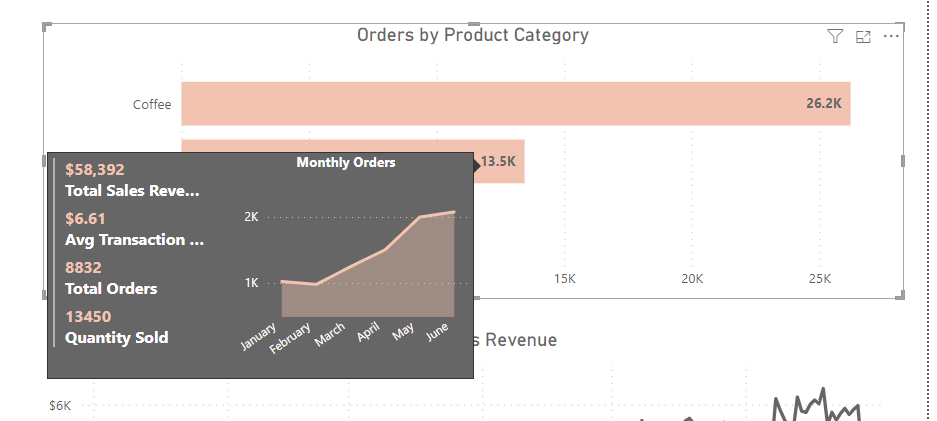
Custom Tooltips in Power BI: Enhance Your Data Storytelling
The data utilized for demonstration purposes was sourced from Kaggle. This ensures that our analysis and insights are based on real-world data, contributing to the authenticity of our findings. Power BI Desktop is a design powerhouse for reports and data visualization. Every chart, graph, and map you create tells a unique story about your data.…
-
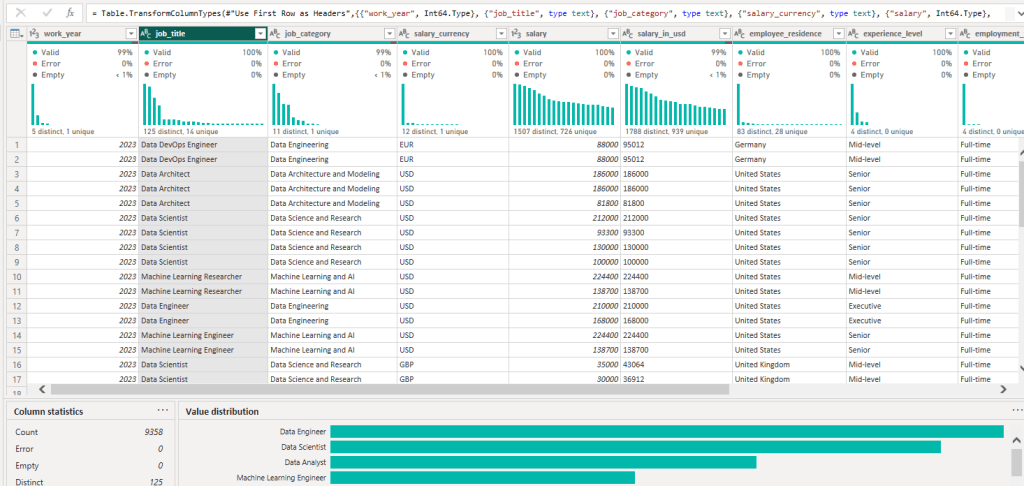
Unlocking Insights: A Beginner’s Guide to Data Profiling in Power BI
The data utilized for demonstration purposes was sourced from Kaggle. This ensures that our analysis and insights are based on real-world data, contributing to the authenticity of our findings. Data profiling in Power BI is a powerful feature that helps you understand and clean your data. This guide will walk you through using these tools,…
