-

Many startups begin their journey with Microsoft Excel, a familiar and accessible ally in data handling. However, as businesses evolve, the need for more advanced analysis and reporting becomes apparent. This is when you should consider a strategic transition from Excel to Power BI, marking a significant leap towards data-driven decision-making. Understanding the Pivot: ExcelContinue…
-

Have you ever wondered how your smartphone can recognize your face among millions or how video streaming services know exactly what you want to watch next? Behind these modern marvels lies a powerful force: machine learning (ML). Let’s demystify this technology. What Exactly is Machine Learning? At its core, machine learning is a technology thatContinue…
-

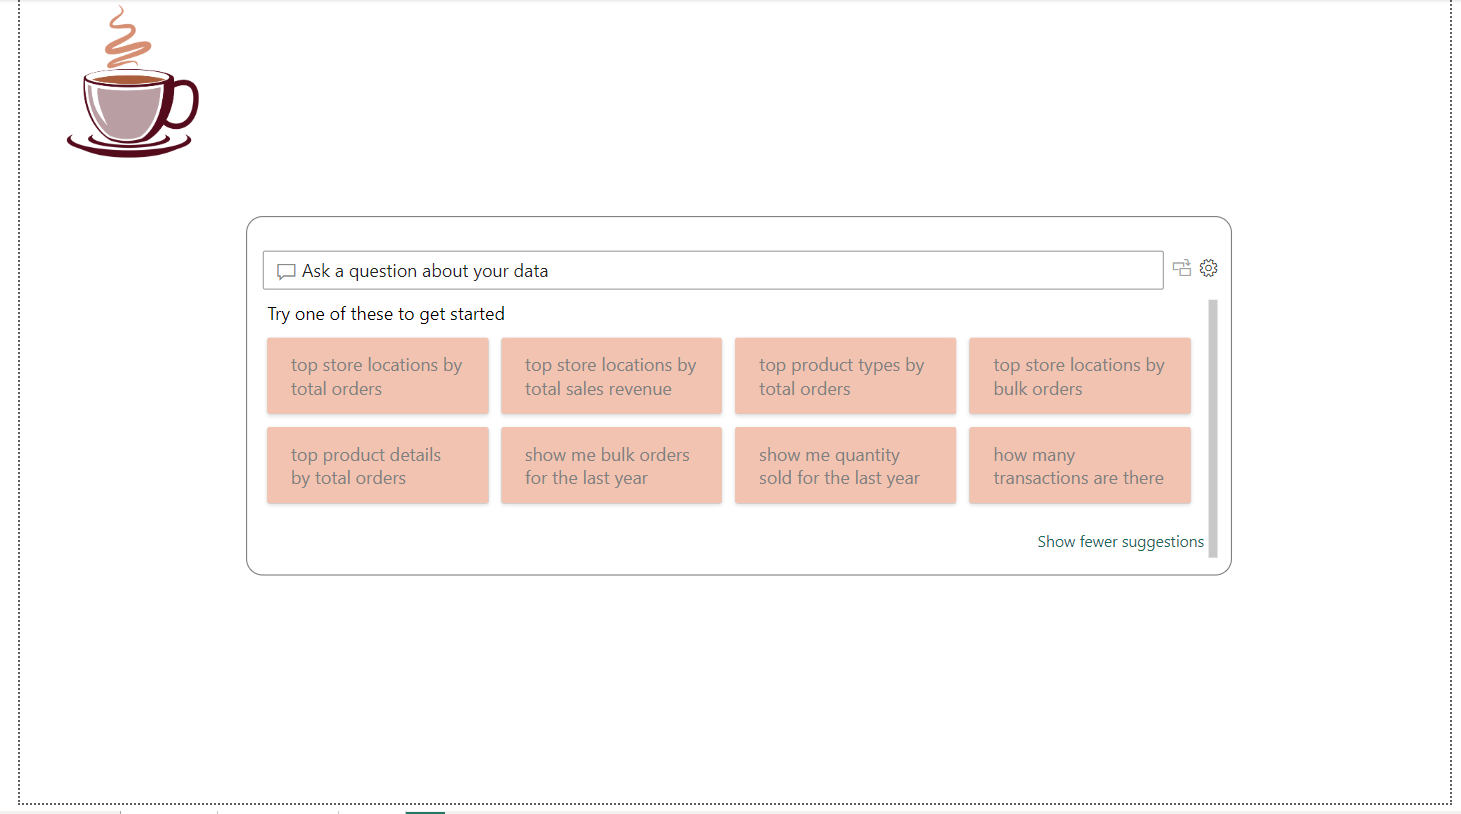
The data utilized for demonstration purposes was sourced from Kaggle. Effective dashboards are designed to deliver high-level, relevant information at a glance, empowered by potent visualizations. To enhance this capability, Microsoft has developed an innovative AI feature in Power BI called Q&A, allowing users to ask data-related questions in natural English and receive instant visualContinue…
-

There was a time when business decisions were made based on gut instinct, personal experience, and a dash of luck. But as the digital revolution took hold, a new era of data-driven decision-making emerged. At the forefront of this transformation is Microsoft’s Power BI, a tool that epitomizes the evolution of business intelligence. Discover howContinue…
-

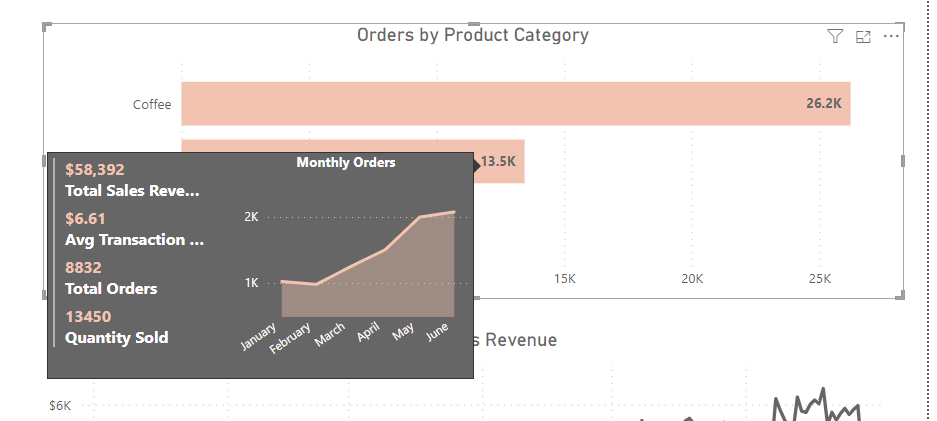
The data utilized for demonstration purposes was sourced from Kaggle. This ensures that our analysis and insights are based on real-world data, contributing to the authenticity of our findings. Power BI Desktop is a design powerhouse for reports and data visualization. Every chart, graph, and map you create tells a unique story about your data.Continue…
-

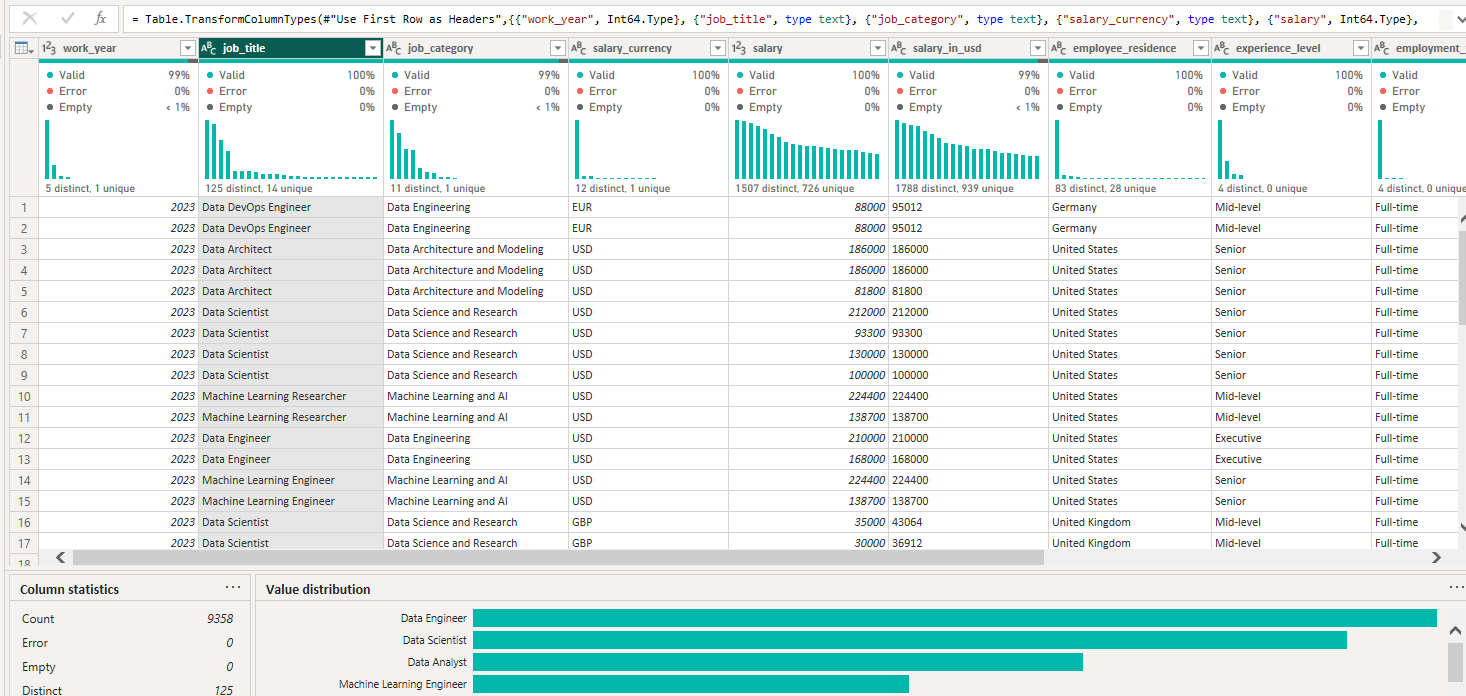
The data utilized for demonstration purposes was sourced from Kaggle. This ensures that our analysis and insights are based on real-world data, contributing to the authenticity of our findings. Data profiling in Power BI is a powerful feature that helps you understand and clean your data. This guide will walk you through using these tools,Continue…
-

In an era where swift adaptation and efficient data project management are pivotal, Docker stands out with its pioneering containerization technology. This technology has proven to be a game-changer for data teams, facilitating seamless development, deployment, and scaling of data-driven applications. If you’re grappling with managing complex projects or looking for ways to enhance yourContinue…
-

Understanding the goldmine of information at your fingertips can be both exhilarating and overwhelming. Imagine having a magic wand that could not only sift through mountains of data but also unearth valuable insights that could propel your operations forward. Google Cloud’s Looker stands out not just as a tool but as a comprehensive platform thatContinue…
-

Navigating Power BI’s capabilities requires a structured approach to prevent disorganization. A dedicated measures table significantly streamlines complexities, enhancing project organization and maintenance by centralizing measures—a fundamental aspect of data analysis and visualization in Power BI. Understanding Measures: The Backbone of Power BI Measures, calculated with Data Analysis Expressions (DAX), are dynamic, real-time calculations thatContinue…
-

Being able to quickly analyze and interpret data is not just a luxury; it’s a necessity. The seamless integration between Microsoft’s Power BI and Excel emerges as a game-changer in data management and analysis. This fusion combines the depth of data manipulation and familiarity of Excel with the dynamic analytics and visualization prowess of PowerContinue…
-
Subscribe
Subscribed
Already have a WordPress.com account? Log in now.