Category: Data Analysis
-
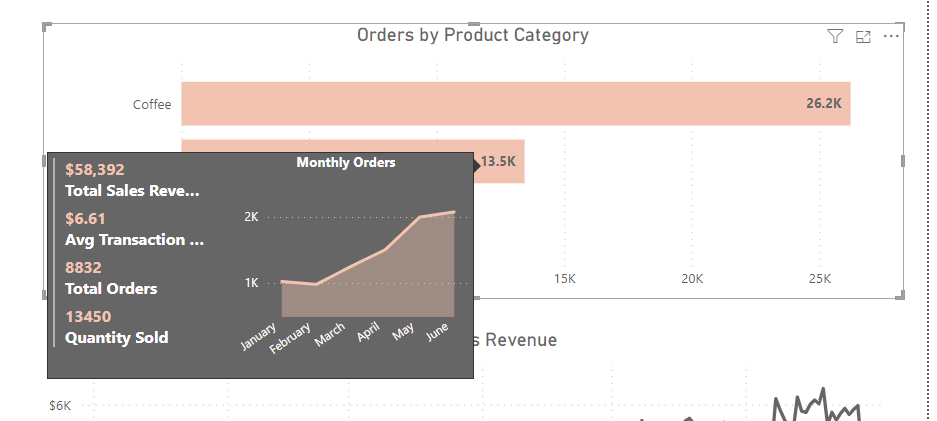
Custom Tooltips in Power BI: Enhance Your Data Storytelling
The data utilized for demonstration purposes was sourced from Kaggle. This ensures that our analysis and insights are based on real-world data, contributing to the authenticity of our findings. Power BI Desktop is a design powerhouse for reports and data visualization. Every chart, graph, and map you create tells a unique story about your data.…
-

Automated Data Insights with Google Cloud’s Looker
Understanding the goldmine of information at your fingertips can be both exhilarating and overwhelming. Imagine having a magic wand that could not only sift through mountains of data but also unearth valuable insights that could propel your operations forward. Google Cloud’s Looker stands out not just as a tool but as a comprehensive platform that…
-

Centralizing Success: The Advantages of a Dedicated Measures Table in Power BI
Navigating Power BI’s capabilities requires a structured approach to prevent disorganization. A dedicated measures table significantly streamlines complexities, enhancing project organization and maintenance by centralizing measures—a fundamental aspect of data analysis and visualization in Power BI. Understanding Measures: The Backbone of Power BI Measures, calculated with Data Analysis Expressions (DAX), are dynamic, real-time calculations that…
-

Power BI and Excel: A Seamless Integration for Enhanced Analysis
Being able to quickly analyze and interpret data is not just a luxury; it’s a necessity. The seamless integration between Microsoft’s Power BI and Excel emerges as a game-changer in data management and analysis. This fusion combines the depth of data manipulation and familiarity of Excel with the dynamic analytics and visualization prowess of Power…
-

Diving into Data: Cleaning vs. Munging
The sheer volume of data generated every second is staggering. This data, in its raw form, can be like an uncut gem—valuable but needing refinement to truly shine. That’s where the crucial processes of data cleaning or data munging step in, ensuring that this wealth of information is not just vast but also valuable and…
-

Cross-Cloud Joins in BigQuery: Bridging Data Across Platforms
Information is the new gold, and the ability to manage and process data efficiently is crucial for decision-making. BigQuery Omni emerges as a pioneering solution, enabling cross-cloud joins—a feature that acts as a magic wand for integrating data scattered across multiple cloud platforms. Unveiling BigQuery Omni At the heart of our journey is BigQuery Omni,…
