Category: Business Intelligence
-

When Should Your Startup Consider Switching from Excel to Power BI?
Many startups begin their journey with Microsoft Excel, a familiar and accessible ally in data handling. However, as businesses evolve, the need for more advanced analysis and reporting becomes apparent. This is when you should consider a strategic transition from Excel to Power BI, marking a significant leap towards data-driven decision-making. Understanding the Pivot: Excel…
-

Power BI’s AI Visuals in Action: Q&A
The data utilized for demonstration purposes was sourced from Kaggle. Effective dashboards are designed to deliver high-level, relevant information at a glance, empowered by potent visualizations. To enhance this capability, Microsoft has developed an innovative AI feature in Power BI called Q&A, allowing users to ask data-related questions in natural English and receive instant visual…
-

The Essentials of Business Intelligence: Getting Started with Power BI
There was a time when business decisions were made based on gut instinct, personal experience, and a dash of luck. But as the digital revolution took hold, a new era of data-driven decision-making emerged. At the forefront of this transformation is Microsoft’s Power BI, a tool that epitomizes the evolution of business intelligence. Discover how…
-
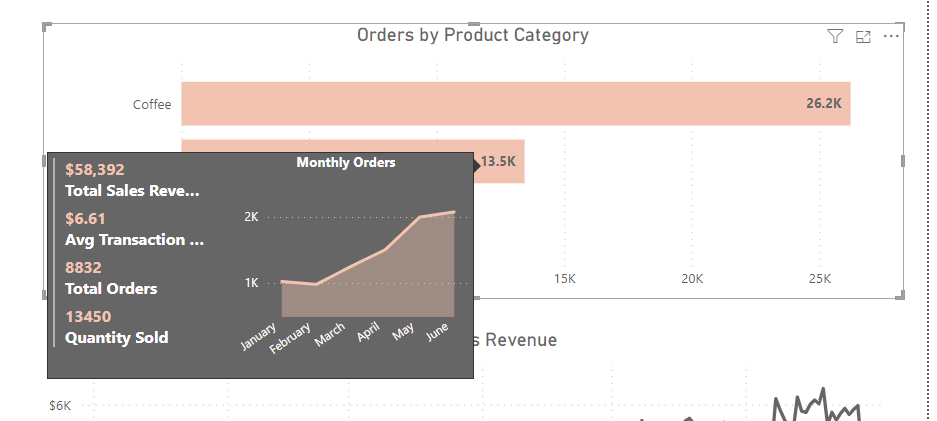
Custom Tooltips in Power BI: Enhance Your Data Storytelling
The data utilized for demonstration purposes was sourced from Kaggle. This ensures that our analysis and insights are based on real-world data, contributing to the authenticity of our findings. Power BI Desktop is a design powerhouse for reports and data visualization. Every chart, graph, and map you create tells a unique story about your data.…
-

Automated Data Insights with Google Cloud’s Looker
Understanding the goldmine of information at your fingertips can be both exhilarating and overwhelming. Imagine having a magic wand that could not only sift through mountains of data but also unearth valuable insights that could propel your operations forward. Google Cloud’s Looker stands out not just as a tool but as a comprehensive platform that…
-

Centralizing Success: The Advantages of a Dedicated Measures Table in Power BI
Navigating Power BI’s capabilities requires a structured approach to prevent disorganization. A dedicated measures table significantly streamlines complexities, enhancing project organization and maintenance by centralizing measures—a fundamental aspect of data analysis and visualization in Power BI. Understanding Measures: The Backbone of Power BI Measures, calculated with Data Analysis Expressions (DAX), are dynamic, real-time calculations that…
