-

Can you look at a set of numbers and tell if something’s not quite right? Yes, it’s possible—numbers don’t lie. But sometimes, they can be tricky to interpret if you don’t know what to look for. Imagine being given a table of data and being asked to find a problem hidden within it, with no other…
-

Imagine trying to find a book in a huge library without a catalog – it would take forever! Indexes in databases work like that catalog, making it easy to find the information you need quickly. In this guide, we’ll explain what indexes are, focusing on a popular type called B-trees. We’ll also show you how…
-

Efficient information sharing and analysis can improve an organization’s success. Snowflake, a cloud-based data warehousing platform, helps with this process through its data sharing features. By separating storage from compute functions, Snowflake allows for smooth scalability and consistent performance, even with multiple users accessing data simultaneously. Its secure data sharing ensures that sensitive information can…
-

Many startups begin their journey with Microsoft Excel, a familiar and accessible ally in data handling. However, as businesses evolve, the need for more advanced analysis and reporting becomes apparent. This is when you should consider a strategic transition from Excel to Power BI, marking a significant leap towards data-driven decision-making. Understanding the Pivot: Excel…
-

Have you ever wondered how your smartphone can recognize your face among millions or how video streaming services know exactly what you want to watch next? Behind these modern marvels lies a powerful force: machine learning (ML). Let’s demystify this technology. What Exactly is Machine Learning? At its core, machine learning is a technology that…
-

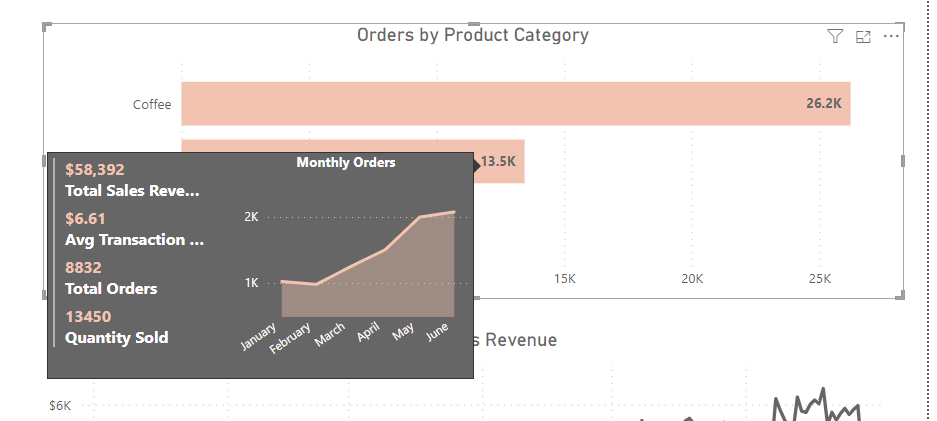
The data utilized for demonstration purposes was sourced from Kaggle. Effective dashboards are designed to deliver high-level, relevant information at a glance, empowered by potent visualizations. To enhance this capability, Microsoft has developed an innovative AI feature in Power BI called Q&A, allowing users to ask data-related questions in natural English and receive instant visual…
-

There was a time when business decisions were made based on gut instinct, personal experience, and a dash of luck. But as the digital revolution took hold, a new era of data-driven decision-making emerged. At the forefront of this transformation is Microsoft’s Power BI, a tool that epitomizes the evolution of business intelligence. Discover how…
-
The data utilized for demonstration purposes was sourced from Kaggle. This ensures that our analysis and insights are based on real-world data, contributing to the authenticity of our findings. Power BI Desktop is a design powerhouse for reports and data visualization. Every chart, graph, and map you create tells a unique story about your data.…
-
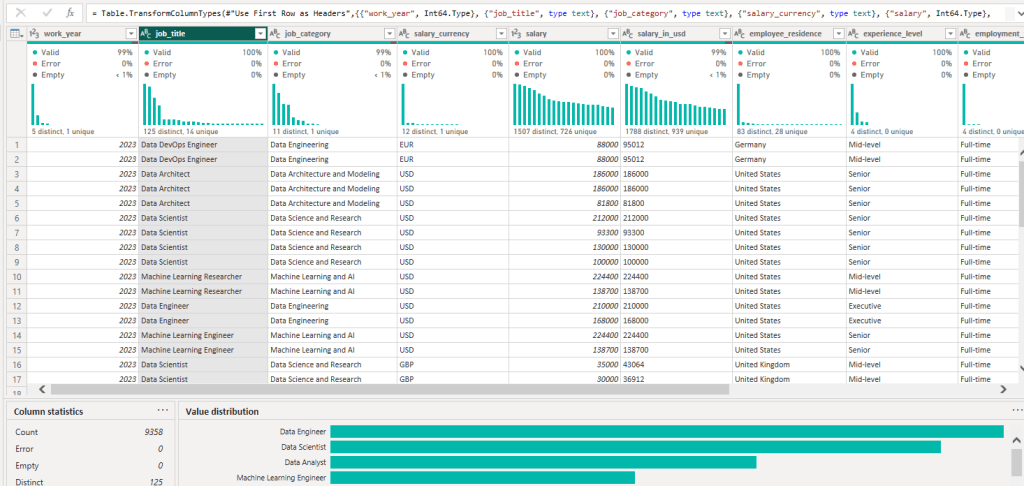
The data utilized for demonstration purposes was sourced from Kaggle. This ensures that our analysis and insights are based on real-world data, contributing to the authenticity of our findings. Data profiling in Power BI is a powerful feature that helps you understand and clean your data. This guide will walk you through using these tools,…
-

In an era where swift adaptation and efficient data project management are pivotal, Docker stands out with its pioneering containerization technology. This technology has proven to be a game-changer for data teams, facilitating seamless development, deployment, and scaling of data-driven applications. If you’re grappling with managing complex projects or looking for ways to enhance your…
-
Subscribe
Subscribed
Already have a WordPress.com account? Log in now.
