Author: TechOply
-

The Essentials of Business Intelligence: Getting Started with Power BI
There was a time when business decisions were made based on gut instinct, personal experience, and a dash of luck. But as the digital revolution took hold, a new era of data-driven decision-making emerged. At the forefront of this transformation is Microsoft’s Power BI, a tool that epitomizes the evolution of business intelligence. Discover how…
-
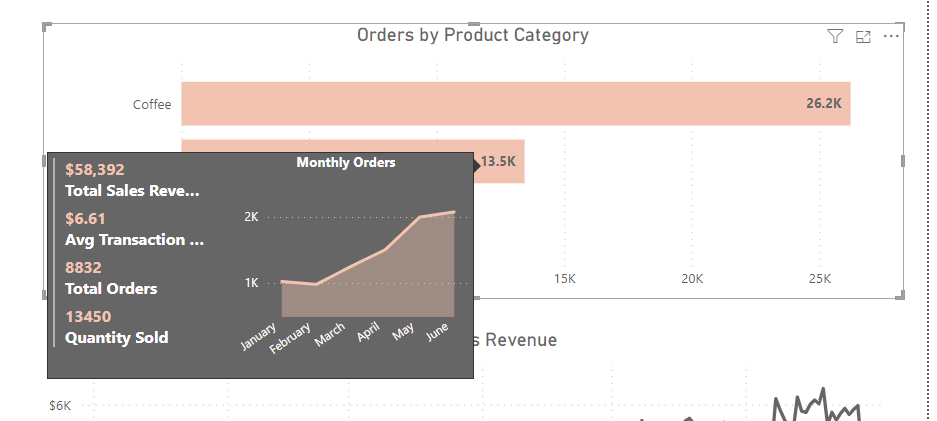
Custom Tooltips in Power BI: Enhance Your Data Storytelling
The data utilized for demonstration purposes was sourced from Kaggle. This ensures that our analysis and insights are based on real-world data, contributing to the authenticity of our findings. Power BI Desktop is a design powerhouse for reports and data visualization. Every chart, graph, and map you create tells a unique story about your data.…
-
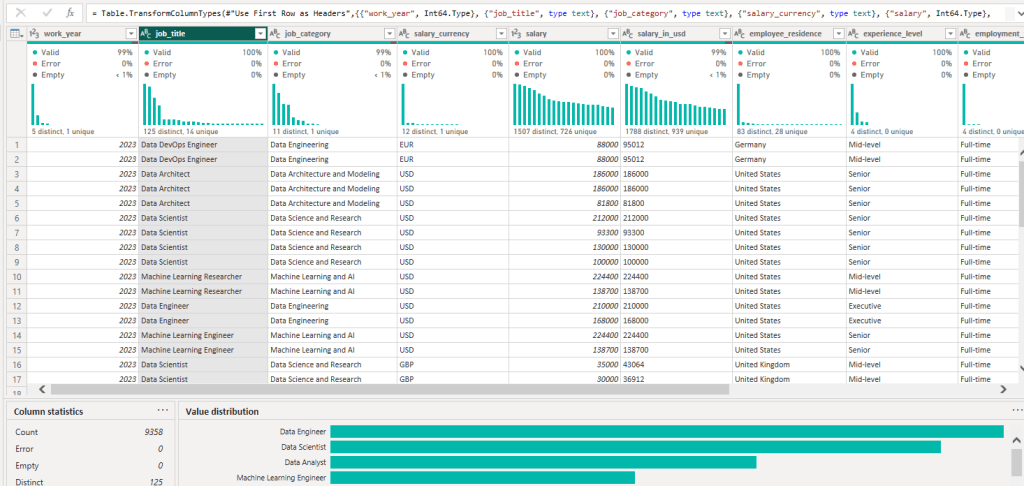
Unlocking Insights: A Beginner’s Guide to Data Profiling in Power BI
The data utilized for demonstration purposes was sourced from Kaggle. This ensures that our analysis and insights are based on real-world data, contributing to the authenticity of our findings. Data profiling in Power BI is a powerful feature that helps you understand and clean your data. This guide will walk you through using these tools,…
-

Docker: Empowering Modern Data Teams with Containerization
In an era where swift adaptation and efficient data project management are pivotal, Docker stands out with its pioneering containerization technology. This technology has proven to be a game-changer for data teams, facilitating seamless development, deployment, and scaling of data-driven applications. If you’re grappling with managing complex projects or looking for ways to enhance your…
-

Automated Data Insights with Google Cloud’s Looker
Understanding the goldmine of information at your fingertips can be both exhilarating and overwhelming. Imagine having a magic wand that could not only sift through mountains of data but also unearth valuable insights that could propel your operations forward. Google Cloud’s Looker stands out not just as a tool but as a comprehensive platform that…
-

Centralizing Success: The Advantages of a Dedicated Measures Table in Power BI
Navigating Power BI’s capabilities requires a structured approach to prevent disorganization. A dedicated measures table significantly streamlines complexities, enhancing project organization and maintenance by centralizing measures—a fundamental aspect of data analysis and visualization in Power BI. Understanding Measures: The Backbone of Power BI Measures, calculated with Data Analysis Expressions (DAX), are dynamic, real-time calculations that…
