Author: TechOply
-
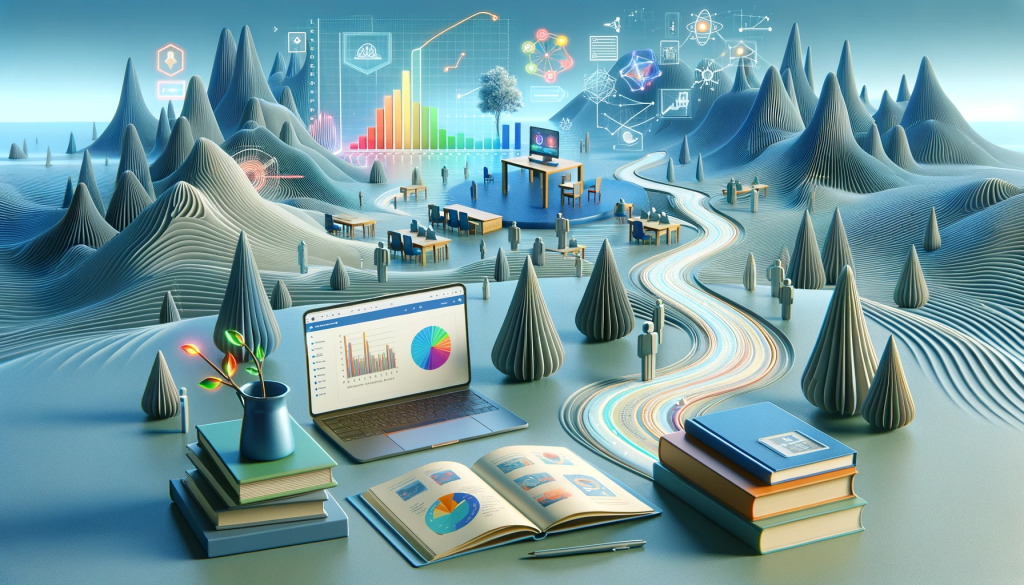
A Beginner’s Roadmap to Mastering Data Visualization and Graph Creation
Have you ever found yourself mesmerized by stunning graphs and visualizations in presentations, evening news, or on websites? They tell a story, don’t they? Learning to create graphs is not just about crunching numbers; it’s an art and science that makes data come alive. It’s a skill that can transform the way you understand and…
-
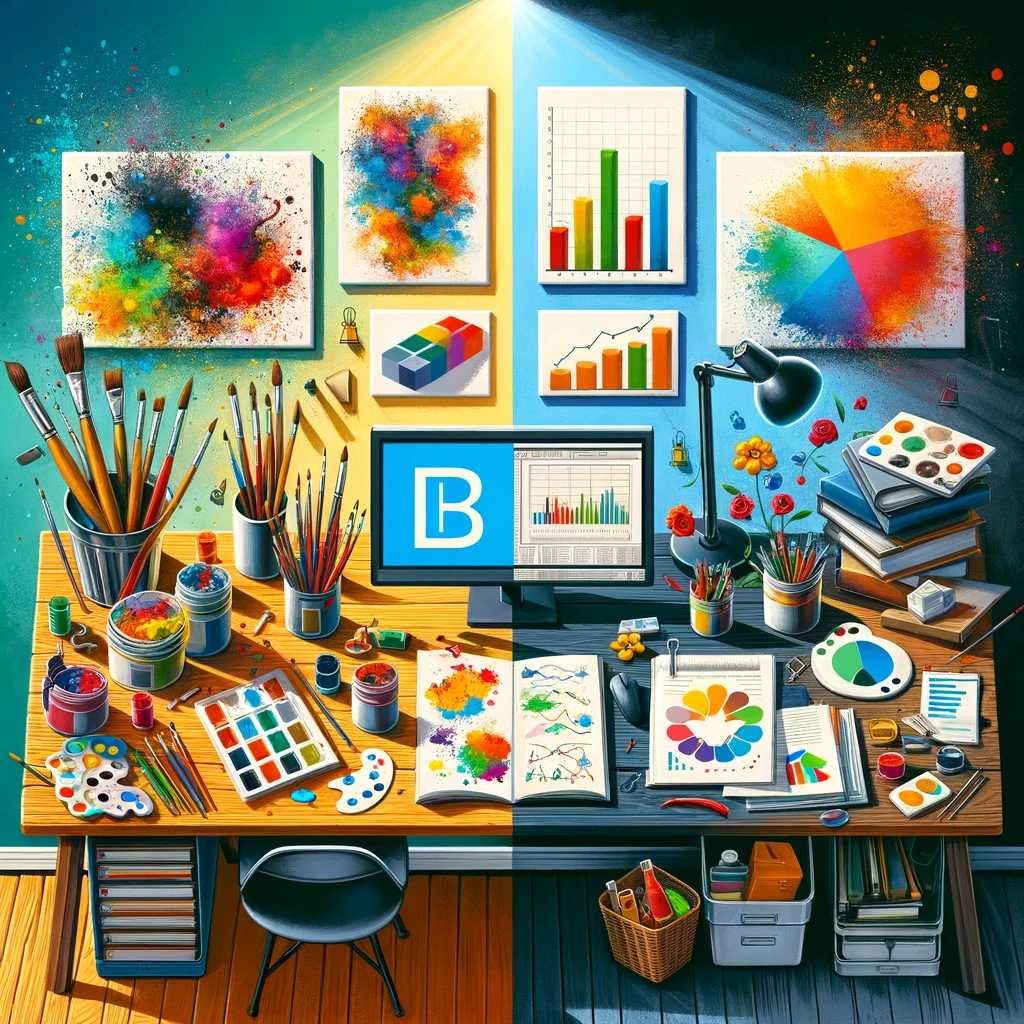
Tableau or Power BI: A Side-by-Side Analysis of Data Viz Leaders
Data visualization tools have become the cornerstone of modern business analytics. Among them, two names frequently dominate the conversation: Tableau and Power BI. But when it comes to choosing between these two tools, the decision isn’t always straightforward. This comparison aims to shed light on their strengths and differences, guiding you to the tool that…
-

The Relationship Between Big Data and IoT
Big data and IoT are more than trendy buzzwords in the tech community. Big data refers to the enormous volume of data generated every second from social media interactions to e-commerce transactions. IoT, or the Internet of Things, involves connecting everyday objects to the Internet, allowing them to send and receive data. Big data, with…
-

Big Data: Understanding Its Volume, Velocity, and Variety
Big data is the colossal wave of information that humanity generates every second. It’s as if every spoken word, every heartbeat, and every click on the internet turned into a data point, flooding into the digital universe. The three Vs of big data—volume, velocity, and variety—describe this deluge. But to truly grasp the concept, let’s…
-

Harnessing the Power of Effective Data Visualization
Have you ever stared at a spreadsheet filled with data and felt lost? That’s where effective data visualization comes in as a game-changer. It’s not just about making pretty charts; it’s a crucial step in understanding trends, making decisions, and communicating insights. With the right data visualization tools, you can lead your audience through a…
-

The Art of Data Visualization: More than Just Pretty Graphs
Data visualization is not just an accessory in the analyst’s toolkit; it’s the cornerstone that can shape the narrative of business strategy and communication. By turning numbers into visual stories, data visualization empowers us to spot trends, understand complex concepts, and make informed decisions swiftly. Painting the Picture with Data Imagine walking into a room…
