
Can you look at a set of numbers and tell if something’s not quite right? Yes, it’s possible—numbers don’t lie. But sometimes, they can be tricky to interpret if you don’t know what to look for. Imagine being given a table of data and being asked to find a problem hidden within it, with no other information. It might sound tough, but this is where a bit of analytics work with data comes in handy.
In this post, we’ll explore a real example where session duration statistics weren’t adding up as expected. There was a bug causing some sessions to last way too long and not being closed after 5 minutes of inactivity, which messed up the results. But how do you spot the issue just by looking at the data? And once you find it, how do you fix it?
Let’s walk through this process together. I’ll show you how we uncovered the problem and used SQL fix to make sure the data tells the right story.
Whether you’re into data analysis or just curious about how these things work, this example will show you how much you can discover by paying close attention to the details.
Prerequisites
- Test data (.csv)
- In this case I used SQLite to create a MySQL DB and import the .csv file
| measure | daily_playtime_minutes_per_user |
|---|---|
| count | 1192.000000 |
| mean | 81.960668 |
| std | 147.130393 |
| min | 0.000000 |
| 25% | 11.212500 |
| 50% | 31.016667 |
| 75% | 83.016667 |
| max | 1303.266667 |
Data Examination
Let’s start with data examination on the above table and explain what each measure represents.
- Count: This represents the total number of entries in the dataset. In this case, it shows that we have 1,192 data points.
- Mean (Average): The mean is calculated by adding up all the values and dividing by the count of values. From the statistics provided, the average playtime per user per day is around 82 minutes.
- Standard Deviation (std): This measures how spread out the numbers are in the dataset. It indicates how much each value typically deviates from the mean. A high standard deviation, like the 147.13 here, suggests a wide variation in playtime among users. – Pay attention to this, this is one indicator that something is off.
- Minimum (min): The smallest value in the dataset. Here, it’s 0 minutes, meaning at least one user didn’t play at all on a given day.
- 25th Percentile: Also known as the first quartile, this value separates the lowest 25% of the data from the rest. It tells us that 25% of the users have a playtime of less than 11.21 minutes.
- Median (50th Percentile): The median splits the data into two equal halves. It’s often used as a central measure, especially when the data has outliers, because it is less affected by extreme values than the mean. Here, the median playtime is about 31.02 minutes.
- 75th Percentile: This value shows that 75% of the users have a playtime of less than 83.02 minutes, indicating that most users’ playtime doesn’t exceed this amount.
- Maximum (max): The largest value in the dataset. The maximum playtime here is 1,303.27 minutes, which likely indicates an issue, such as sessions not ending properly.
Initial Observations
From the data, a few key issues stand out:
- High Standard Deviation Compared to Mean(Average): The standard deviation of 147.13 is significantly higher than the mean(average) playtime of 81.96 minutes. In fact, it’s almost double the mean(average), which suggests a wide variation in playtime. This large spread explains the bug where sessions don’t close after 5 minutes of inactivity, leading to unusually long sessions. This inflation of figures indicates that some users play for a very short time, some for a very long time, and others fall somewhere in between, rather than most users playing for a similar amount of time each day. The high variability makes it less reliable to predict outcomes based on the average alone because the values are spread out widely from the mean.
- Very High Maximum Value: The maximum playtime recorded is 1,303.27 minutes, which is over 21 hours in a single day. This is unusually high for daily gameplay, likely indicating that some sessions were not closed properly. This extreme value is skewing the overall playtime statistics and affecting the accuracy of the data.
- Outliers Affecting the Mean(Average): The mean playtime is higher than the median (81.96 minutes vs. 31.02 minutes), which suggests the presence of outliers. These outliers are inflating the average playtime, making it seem like users, on average, play more than they actually do. In reality, while the average is around 82 minutes, the actual playtime per user varies widely. Some users play much less than 82 minutes, others play much more, and there are a few extreme cases that are distorting the overall average.
Solving the Issue
To fix the problems we’ve identified, here are the steps we can take:
- Fix the Inactivity Tracking: It’s important to update the analysis scripts so that it automatically tracks and ends a session if there’s a long gap (in our specific case more than 5 minutes) between consecutive events under the same session ID. To do this, we can add a new column that checks the time difference between each event and the one before it in the same session. If the gap is more than 5 minutes, we treat it as the end of that session and start a new one. This way, we can break up the long sessions into smaller, more accurate ones.
- Filter Out Long Sessions (optional): We can track the sessions that are way too long because of the known issue. We can set a reasonable limit on how long a session should last based on normal user behavior. This will help prevent these super long sessions from messing up the overall playtime data.
Expected Improvements After Applying Corrections
Once we fix the issues by adjusting the outliers here’s what we can expect:
- More Accurate Averages: The average (mean) and median playtime should now better match how most users actually behave, without being thrown off by a few really long sessions.
- More Reliable Playtime Data: With the outliers dealt with, the playtime metrics will be more reliable. This means the numbers will give us a true picture of how much time users are spending, which is crucial for understanding engagement.
- Fewer Extreme Values: Fixing the session lengths will reduce those unusually high playtime numbers, which in turn will lower the standard deviation. This makes the data less spread out and more consistent.
- Tighter Data Spread: By stopping sessions from getting too long, the playtime values will be closer together, making the average playtime more meaningful.
Overall, these changes will make the data more accurate and useful for understanding how users are really interacting with the platform.
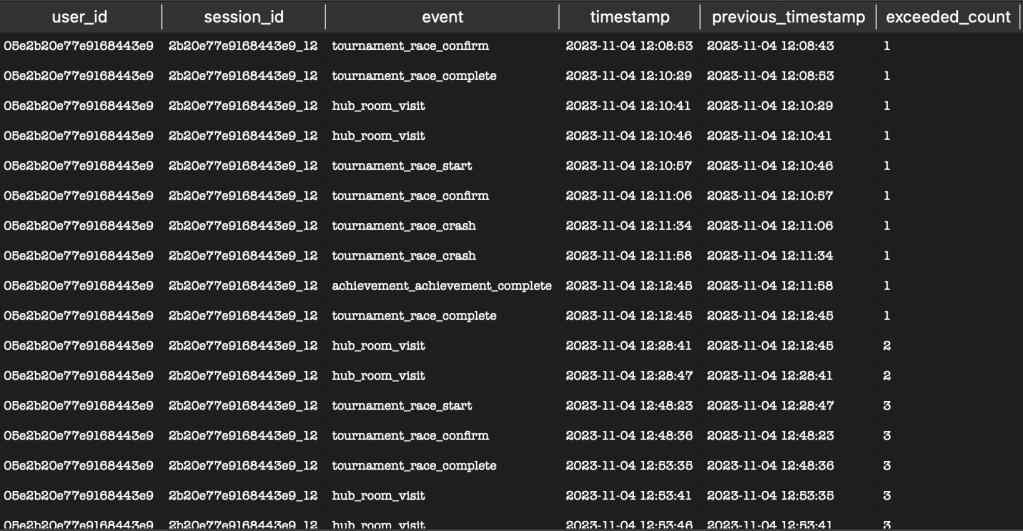
Let’s look at the example and apply SQL logic to properly identify sessions that did not close properly after 5 minutes of inactivity, but they are still grouped under the same session (highlighted in yellow)
The SQL code below is split into separate code blocks for better understanding and explanation of each step.
Ex. session_id 2b20e77e9168443e9_12
- Column 1 – event_timestamp
- Column 2 – event
- Column 3 – user_id
- Column 4 – session_id

- Prepares data by getting the previous timestamp for each event in the sequence, grouped by user_id and session_id. With this we can keep track of the timestamp of the current event and the previous event.
WITH TimedEvents AS (
    SELECT
        user_id,
        session_id,
        event,
        timestamp,
        COALESCE(LAG(timestamp) OVER (PARTITION BY user_id, session_id ORDER BY timestamp), timestamp) AS previous_timestamp
    FROM
        event_data
    WHERE
        session_id = '2b20e77e9168443e9_12'
)
2. Calculates the gap in seconds between consecutive events ( current timestamp of an event vs previous timestamp of an event in the same session_id)
SessionGaps AS (
    SELECT
        user_id,
        session_id,
        event,
        timestamp,
        previous_timestamp,
        strftime('%s', timestamp) - strftime('%s', previous_timestamp) AS gap_seconds
    FROM
        TimedEvents
)
3. Determines if a session exceeded (more than 5 minutes). If yes sets 1 if not 0
SessionExeceds AS (
    SELECT
        user_id,
        session_id,
        event,
        timestamp,
        previous_timestamp,
        (gap_seconds > 300) OR (previous_timestamp IS NULL) AS session_exceeded
    FROM
        SessionGaps
)
4. Calculates sum of how many times a different event exceeded in one session, so we can be able to create a unique identifier for these. We should treat these as new sessions.
AdjustedSessions AS (
    SELECT
        user_id,
        session_id,
        event,
        timestamp,
        previous_timestamp,
        SUM(session_exceeded) OVER (PARTITION BY user_id, session_id ORDER BY timestamp) AS exceeded_count
    FROM
        SessionExceeds
)
What is SUM with OVER (PARTITION BY ...) Doing?
Cumulative Sum: The SUM function within the OVER clause is performing a cumulative sum (running total) of the session_exceeded values as you move down the list of events ordered by timestamp.
Partitioning: The PARTITION BY user_id, session_id ensures that this cumulative sum restarts for each new combination of user_id and session_id. This is crucial because it allows the query to track the session breaks separately for each user and session.
Tracking Session Breaks: Whenever session_exceeded is 1, it increments the cumulative sum (exceeded_count). This effectively “marks” a new sub-session starting from that point. Subsequent rows within the same original session will have an incremented exceeded_count, signifying they belong to a new logical sub-session.
5. Generates new session identifiers with the sessions that exceeded by concatenating session_id and the exceeded count in the value.
NewSessionIDs AS (
    SELECT
        user_id,
        session_id || '-' || CAST(exceeded_count AS TEXT) AS new_session_id,
        event,
        timestamp,
        previous_timestamp
    FROM
        AdjustedSessions
)
We can see that the session_id = ‘2b20e77e9168443e9_12‘ was split into 5 separate new sessions, due to the fact that five events lasted longer than 5 minutes. Take note of the new_session_id column. If we did not apply the above SQL logic, this session_duration_minutes would be 121 minutes (total of all session_duration_minutes).

In summary, the SQL script takes event data and breaks down user sessions into smaller, more detailed sub-sessions. By identifying significant gaps in time between events, the script splits longer sessions into shorter, more relevant segments. This approach helps us better understand how users interact over time by focusing on these smaller segments.
With this method, we can see patterns in user behavior that might not have been clear in the overall session data. This clearer picture of user activity can help us make more informed decisions, whether we’re looking to improve user engagement or enhance the user experience.
As we’ve seen, paying close attention to the details in your data can reveal issues that might otherwise go unnoticed. By carefully analyzing your data and applying the right fixes, you can ensure that your results are accurate and truly reflective of the behavior that you are analyzing.
I hope this has helped you see how important it is to spot and fix data issues so you can make better, data-driven decisions!

Leave a comment