The data utilized for demonstration purposes was sourced from Kaggle. This ensures that our analysis and insights are based on real-world data, contributing to the authenticity of our findings.
Power BI Desktop is a design powerhouse for reports and data visualization. Every chart, graph, and map you create tells a unique story about your data. But what if you could make your data narratives even more compelling and intuitive? Introducing custom tooltips, a feature that transforms how your audience interacts with your visualizations.
The Magic Behind Tooltips
Hovering over a data point and getting a snapshot of insights tailored just for you—that’s the power of tooltips! By default, Power BI is already intuitive enough to offer a basic glimpse into your data when you hover over elements in your visualizations. Yet, there’s so much more you can do.
Custom Tooltips in Power BI Desktop
Custom tooltips in Power BI Desktop take your data storytelling to a whole new level. Instead of generic details, imagine providing insights specifically curated for your audience’s needs. Here’s why you should consider upgrading:
- User Engagement: Custom tooltips offer a more engaging way for users to interact with your data.
- Targeted Information: Deliver exactly what your audience seeks, directly under their cursor.
- Visual Appeal: Add a dash of creativity to your tooltips with charts, images, or even narratives that complement your data.
Crafting Your First Custom Tooltip: A Step-by-Step Guide
Creating custom tooltips in Power BI might seem daunting at first, but it’s actually quite straightforward. To illustrate the process, we are using a public Coffee Shop Sales dataset downloaded from Kaggle. For the sake of this example, we created a simple dashboard that includes some of the main KPIs and graphs. We have also created a separate measures table that includes:
- Average Transaction Value
- Quantity Sold
- Total Orders, and
- Total Sales Revenue.

Step 1: Identify Your Main Visualization
Pick a visualization on your dashboard that you want to give more context to. We have chosen the “Orders by Product Category” clustered bar chart.
Currently, if we hover over any of the three categories in this viz, Power BI will automatically offer us information about the specific category’s order quantity as a tooltip.
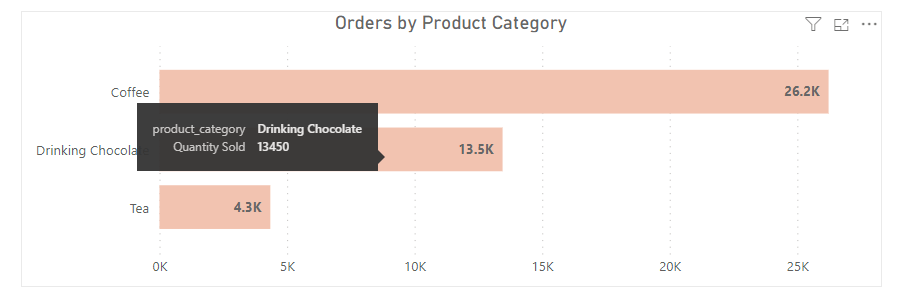
However, we want to show way more than that to our stakeholders. Let’s take this one step further!
Step 2: Create a New Page
In Report view, add a new page.
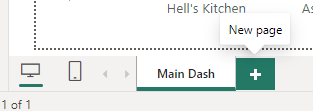
This page will serve as the custom tooltip for your main visualization (Orders by Product Category). In other words, once configured, the content you craft on this new page will appear when someone hovers over a data point in the main visual.
Step 3: Adjusting the Page Settings
On the new page you just created, go to the Visualizations ribbon and expand Page information.

If you haven’t yet, give your page a name. Toggle “Allow use as tooltip” on.
You will notice the canvas dimensions automatically change. You can update this under “Canvas settings” by choosing a Custom Type from the drop-down list. In our example, we changed the height to 225 px and the width to 425 px.
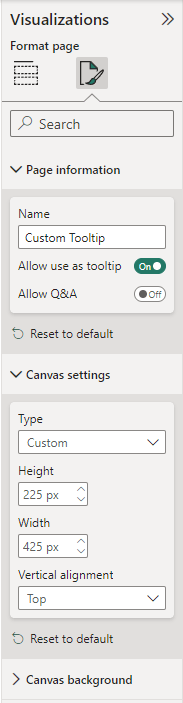
We are now ready to start adding relevant information to our custom tooltip.
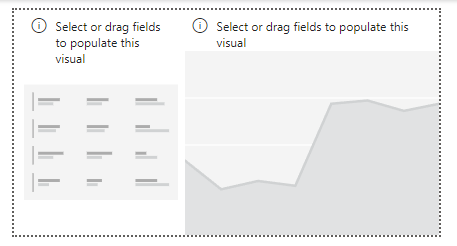
Step 4: Design Your Tooltip
Insert your preferred visuals to create a compelling and informative tooltip. Think of this as a mini-report that provides additional context to the main visualization.
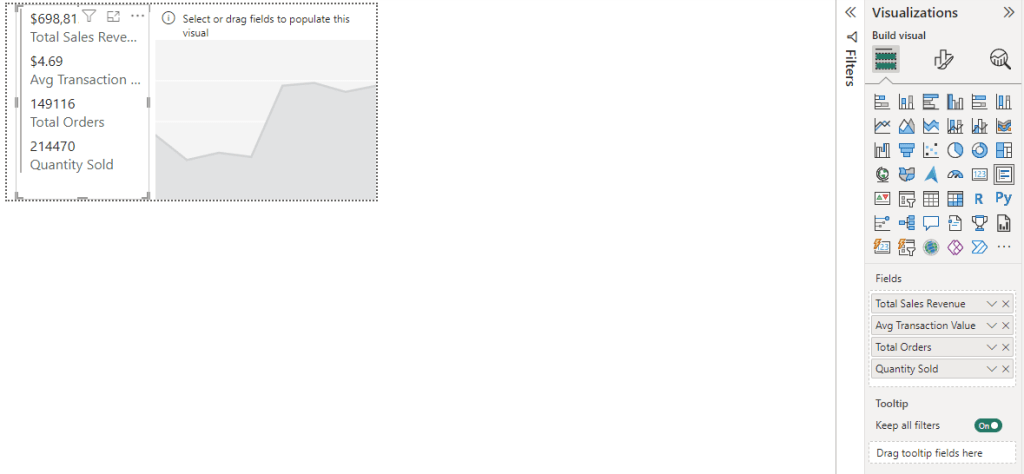
In our example, we will populate the tooltip with 2 visuals:
- A multi-row card to indicate a breakdown of the main KPIs by product category.
- An area chart to indicate the order trend over time by product category.
We will indicate the main KPIs again in the multi-row card as follows:
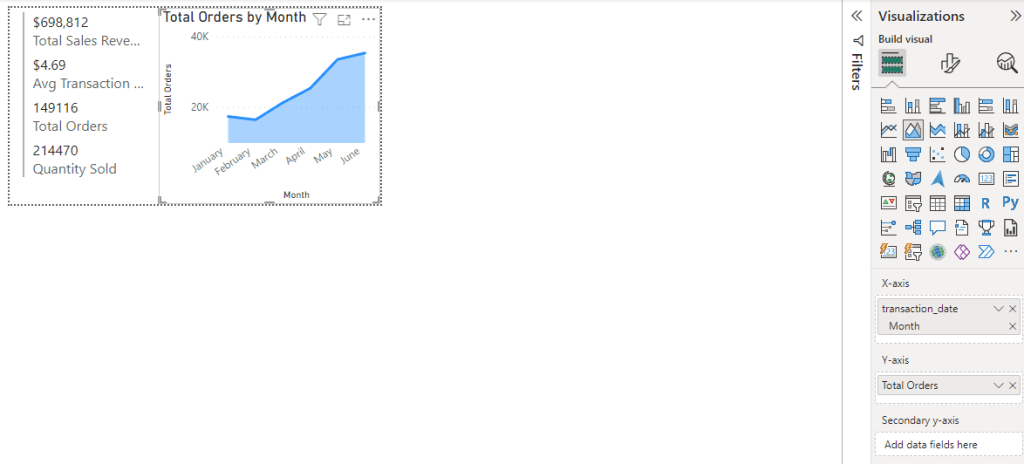
In the area chart, we populate the X-axis with transaction_date from the Transactions table and the Y-axis with the Total Orders measure. Since the dataset is based on roughly half a year, we retained a monthly breakdown.
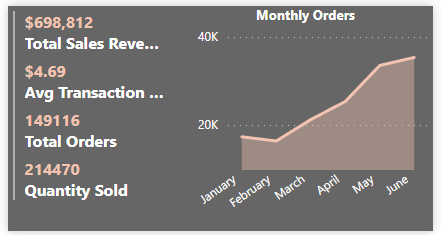
Enhance your custom tooltip by formatting both visuals. Here, this is all about your creativity. We ended up with the following result:
Now that your custom tooltip has been configured, it’s time to connect your custom tooltip to the main visualization!
Step 5: Activate Your Custom Tooltip
Head back into your main dashboard and click on the main visualization (Orders by Product Category). In “Format your visual,” open the Tooltips drop-down menu. Here, the “Type” should be “Report page”. Choose your custom tooltip page as the connected page.

And that’s it! The connection has been established, and if you hover over any of the categories in the Orders by Product Category visual, your custom tooltip appears, filtered based on the category that you are currently hovering over.
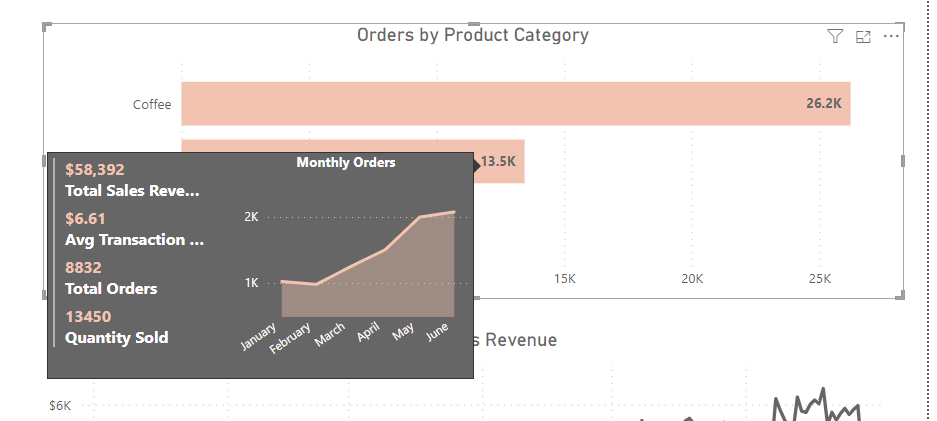
Try it out!
Engaging Examples to Inspire You
To spark your creativity, consider these innovative uses of custom tooltips in Power BI Desktop:
- Trend Analysis: Show a mini trend graph for the data point being hovered over, giving instant insight into historical performance.
- Comparative Insights: Use tooltips to compare the hovered-over data with other periods or categories, offering immediate context.
- Narrative Insights: Include a brief narrative or explanation within the tooltip, guiding your audience through the data story.
Best Practices for Unforgettable Tooltips
Crafting memorable custom tooltips in Power BI is an art. Here are some tips to master it:
- Keep It Relevant: Ensure the information is directly related to the data point or visualization.
- Simplicity Is Key: Avoid clutter. Aim for a clean, concise presentation of insights.
- Visual Consistency: Your tooltips should complement the overall design of your report, maintaining visual harmony.
- Hide the Custom Tooltip page: Typically, you do not want people to see or edit your custom tooltip page, so the best practice is to hide this page (right-click on the page and select Hide).
Ready to Transform Your Data Storytelling?
Now that you’ve seen the incredible potential of custom tooltips in Power BI to enhance your data visualizations, it’s time to put this knowledge into action. Start experimenting with different types of content and designs for your tooltips. The goal is to make your data not just seen, but experienced.
Remember, the best data stories are those that engage, inform, and inspire. With custom tooltips, you’re equipped to do all three. So, dive in, get creative, and watch as your data stories come to life in ways you never imagined.
