The data utilized for demonstration purposes was sourced from Kaggle. This ensures that our analysis and insights are based on real-world data, contributing to the authenticity of our findings.
Data profiling in Power BI is a powerful feature that helps you understand and clean your data. This guide will walk you through using these tools, making it simple and straightforward.
What is Data Profiling?
Data profiling in Power BI gives you a quick look at your data’s condition. It shows things like:
- How your data is spread out.
- Where you have empty or missing values.
- Counts of unique data points.
This helps you spot and fix issues fast, ensuring your data is clean and reliable for analysis.
Step 1: Open Power BI and Load Data
First up, open Power BI Desktop. To start working with your data, click on “Get Data” and select your data source. Once you’ve chosen your dataset, load it into Power BI.
Step 2: Accessing Data Profiling Features
With your data loaded, head over to the “View” tab. Here, you’ll find two helpful options for data profiling:
- Column Quality: This shows the quality of data in each column.
- Column Distribution: This gives you an idea of how your data is distributed.
- Column Profile: This feature provides a more in-depth look at the data in a column.
Click on these options to turn on data profiling views for your dataset.

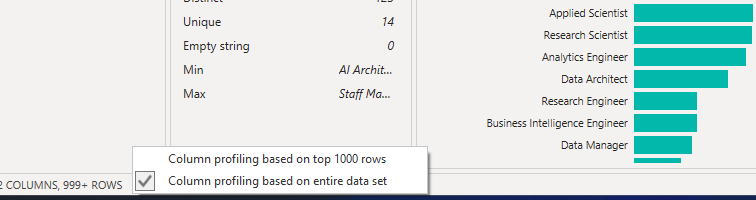
By default, Power Query conducts data profiling on the initial 1,000 rows of your dataset. To extend this analysis to the entire dataset, simply click on the ‘Column profiling based on top 1000 rows’ message located in the lower-left corner of your editor window. Then, choose ‘Column profiling based on entire dataset’ to ensure comprehensive column profiling across all your data.
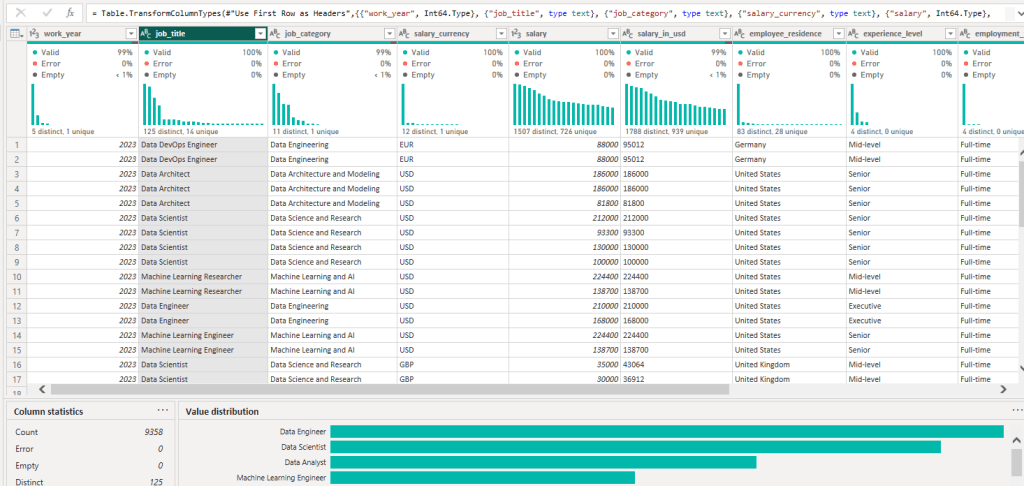
Step 3: Understanding Column Quality
The Column Quality bar shows you at a glance the state of your data:
- Valid: Data that fits the expected format.
- Error: Data that has issues or doesn’t fit the expected format.
- Empty: Cells that have no data in them.
This quick visual helps you see where you might need to clean up your data.

The number of records in each column quality category is also displayed as a percentage.
When you hover over any column, you’ll see the numerical distribution showing the quality of values within that column. Plus, clicking on the ellipsis button (…) reveals quick action buttons for performing operations on those values.

Step 4: Exploring Column Distribution
The Column Distribution view lets you see how often different values appear in your data. This can help you understand patterns and anomalies, giving you insight into what your data is telling you.

It’s important to note the distinction between “Distinct” and “Unique.” While these terms may sound alike, they carry different meanings.
- “Distinct” indicates the count of values in the column after removing duplicates.
- “Unique” displays the count of values that appeared only once.
In other words, if you remove all duplicates from a column, the number of distinct values and the number of unique values will be the same.
Step 5: Column Profile
This feature offers a deeper dive into the data within a column, showcasing not only the column distribution chart but also a column statistics chart. This detailed information appears below the data preview section, as illustrated in the image below

Step 6: Cleaning Your Data
Based on what you find in the data profiling views, you might need to clean your data. This could involve:
- Removing or correcting errors.
- Filling in empty values.
- Standardizing data formats.
Power BI’s Query Editor is a great tool for this.
Step 7: Using Your Insights
After cleaning, you’re ready to use your data for making reports and dashboards. Clean data means more accurate and reliable insights, helping you make better decisions.
Why It Matters
Using data profiling tools in Power BI helps you:
- Save Time: Spot and fix data issues early, so you don’t run into problems later.
- Trust Your Data: Feel confident in the accuracy and quality of your data.
- Make Better Decisions: Use clean, reliable data to inform your analysis and recommendations.
From Profiling to Precision
Data profiling in Power BI is like having a health check for your data. It’s a crucial step in preparing your data for analysis, helping you ensure that the insights you derive are based on solid, clean data. By following these simple steps, you can make your data work better for you, leading to more informed decisions and strategies. So, dive in, start profiling your data today, and see the difference it makes in your data analysis journey.
