
Navigating Power BI’s capabilities requires a structured approach to prevent disorganization. A dedicated measures table significantly streamlines complexities, enhancing project organization and maintenance by centralizing measures—a fundamental aspect of data analysis and visualization in Power BI.
Understanding Measures: The Backbone of Power BI
Measures, calculated with Data Analysis Expressions (DAX), are dynamic, real-time calculations that form the backbone of Power BI’s analytical capabilities. Unlike static calculated columns, measures adjust according to the report’s context, making them indispensable for creating responsive, interactive reports.
Why Separation Makes Sense
A separate measures table improves organization, simplifies maintenance, and enhances model intuition, although it may not be necessary for very small projects. The benefits include:
- Improved Organization: A dedicated measures table acts like a central library where all your measures are cataloged, making them easier to find and manage.
- Easier Maintenance: Updating a single measure in a centralized location is simpler and less error-prone than navigating through multiple tables.
- Enhanced Performance: Although measures themselves don’t impact model size, organizing them neatly can streamline the development process and make your model more intuitive.
Despite all the benefits listed, keep in mind that not every project requires a separate measures table, particularly small ones with few measures. The decision should be based on project complexity and scale.
Crafting Your Measures Table: A Simple Guide
Creating a measures table is straightforward and can be approached in two ways, depending on your familiarity with Power BI tools.
Option 1: Enter Data into Power Query
- Open Power Query Editor: Accessible from the “Home” tab by clicking “Transform Data.”
- Create a New Table: Use “Enter Data” within Power Query to manually create a table. This table, designated for measures, requires only a single column. Name it “Measure Names” and insert a placeholder value if desired.
- Name Your Table: Specify a descriptive name, like “MeasuresTable.”
- Load the Table: Finalize and load your table into the data model by clicking “OK” and closing the Power Query Editor.
Option 2: Create a Calculated Table Using DAX
- Open the Report View: In Power BI Desktop, switch to Table view.
- Create a New Table: On the Home ribbon, click “New table.” This opens a formula bar where you can enter a DAX expression to create your table.
- Enter DAX Expression: Use
MeasuresTable = ROW("DummyColumn", BLANK())to create a table named “MeasuresTable” with a placeholder column. This column is merely for table creation purposes. - Adjust as Needed: The table created will appear in your data model but not in Power Query. You can now add measures to this table by creating them in the report view and associating them with this table.
After Creating Your Measures Table
- Move Existing Measures: If you already have measures scattered across different tables, you can now move them to your newly created measures table. In Report view, simply expand your Data pane, click on the measure you wish to move, and change its “Home table” (you will find this in the upper left on the “Measure tools” ribbon) to your new measures table.
- Organize and Document: Use meaningful names for your measures and consider adding descriptions to document their purpose and calculation logic. This can be done in the measure settings.
By following these steps, you’ll have a centralized place for your measures, making your Power BI model more organized and easier to maintain. Whether you choose to use Power Query or DAX, the key is finding the approach that best fits your project’s needs and your workflow.
The Impact of a Measures Table
Adopting a dedicated measures table can significantly elevate your approach to your Power BI projects. It brings a level of clarity and efficiency that facilitates:
- Streamlined Report Development: With all measures in one place, report creation becomes faster and more intuitive.
- Enhanced Collaboration: Teams can work more effectively when measures are organized, documented, and centralized.
- Intuitive User Experience: End-users find it easier to navigate and understand reports when measures are neatly categorized.
Best Practices for Measures Table Management
To get the most out of your measures table in Power BI, consider the following tips:
- Keep Documentation: Document your measures to clarify their purpose, calculation logic, and any dependencies.
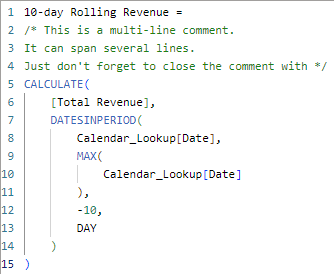
You can leave a single-line comment by using two forward slashes (//).

You can leave a multi-line comment by adding the comment between a forward slash + asterisk (/*) and an asterisk + forward slash (*/).
- Version Control: As your project evolves, maintain versions of your measures table to track changes and updates.
- Regular Audits: Periodically review your measures table to remove obsolete measures and ensure all calculations are accurate.
Watch Out for These Pitfalls
While a measures table can be a game-changer, be wary of common mistakes:
- Overcomplication: Don’t create measures for the sake of it. Each measure should serve a clear purpose in your reporting.
- Neglecting Documentation: Failing to document your measures can lead to confusion and errors, especially in collaborative settings.
Embrace Organization
The journey to a more organized, efficient, and intuitive Power BI model begins with the simple step of centralizing your measures. A measures table in Power BI is not just a best practice; it’s a transformative approach that can elevate your data projects to new heights. Embrace this strategy, and watch as your reports become more insightful, your workflow smoother, and your team more cohesive.
In the world of data, organization is not just about keeping things tidy; it’s about making insights accessible, actionable, and, ultimately, more powerful.
